Project Overview
Schneider FreightPower is a digital platform that helps truck drivers book loads and keep their trips moving. But for many drivers and dispatchers, choosing the best route wasn’t always easy. It was hard to quickly see which loads made the most sense, based on timing, pay, or where they needed to go next. So we set out to redesign that experience. Our goal was to create a map-based solution that made route planning more visual and more straightforward.
UI/UX Designer / Scrum Master
DURATION

Design Challenges
While Schneider FreightPower provides valuable features for load booking and route planning, users frequently encounter recurring challenges. Common issues include slow data loading and a lack of detailed route or load information, which creates friction for drivers when trying to make timely and informed decisions. These usability gaps highlight opportunities to improve the app’s reliability, data transparency, and overall user experience for truck drivers on the move.


Scrum and Jira
Another key challenge was the tight timeline. With only two months to complete the project, we adopted a Scrum framework with one-week sprints and used Jira to keep the team focused and deliver iteratively.
Sprint Structure
Monday: Sprint planning
Tuesday–Friday: Daily standups and team collaboration
Sunday: Sprint review and retrospective
TO DO
Create
IN PROGRESS
3
DONE
6


Research
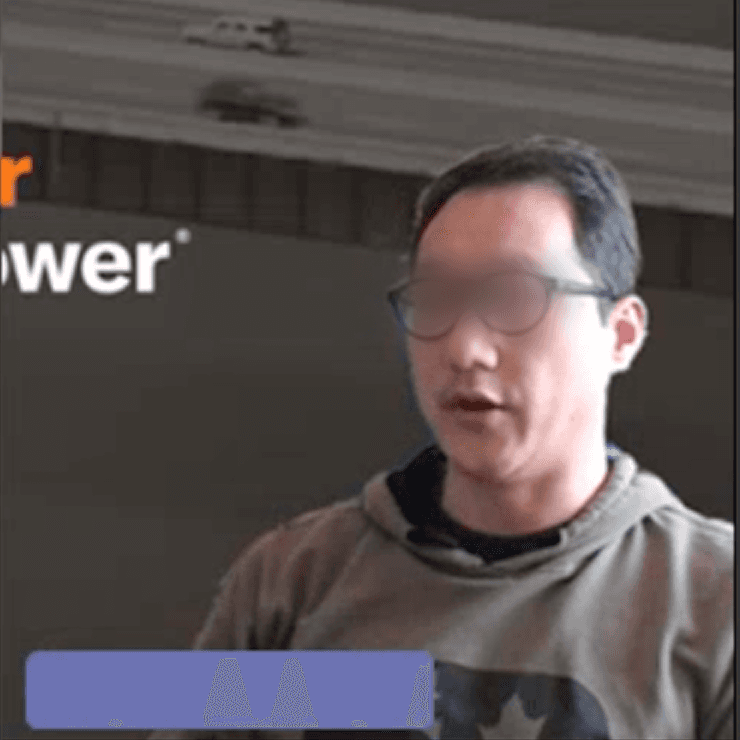
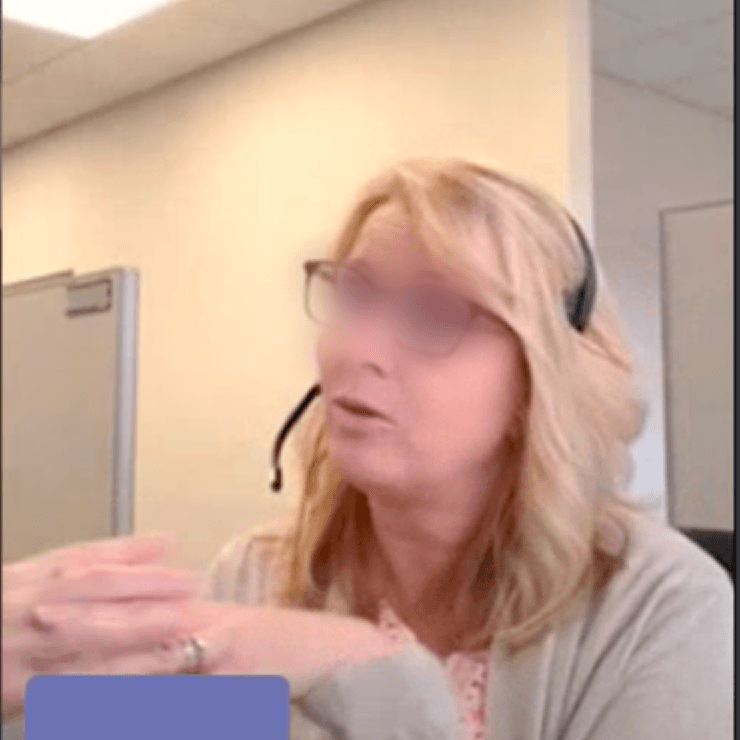
Since trucking was a new domain for me, I interviewed over ten diverse team members from Schneider to understand both the business needs and the real pain points users face. Here are the key insights:
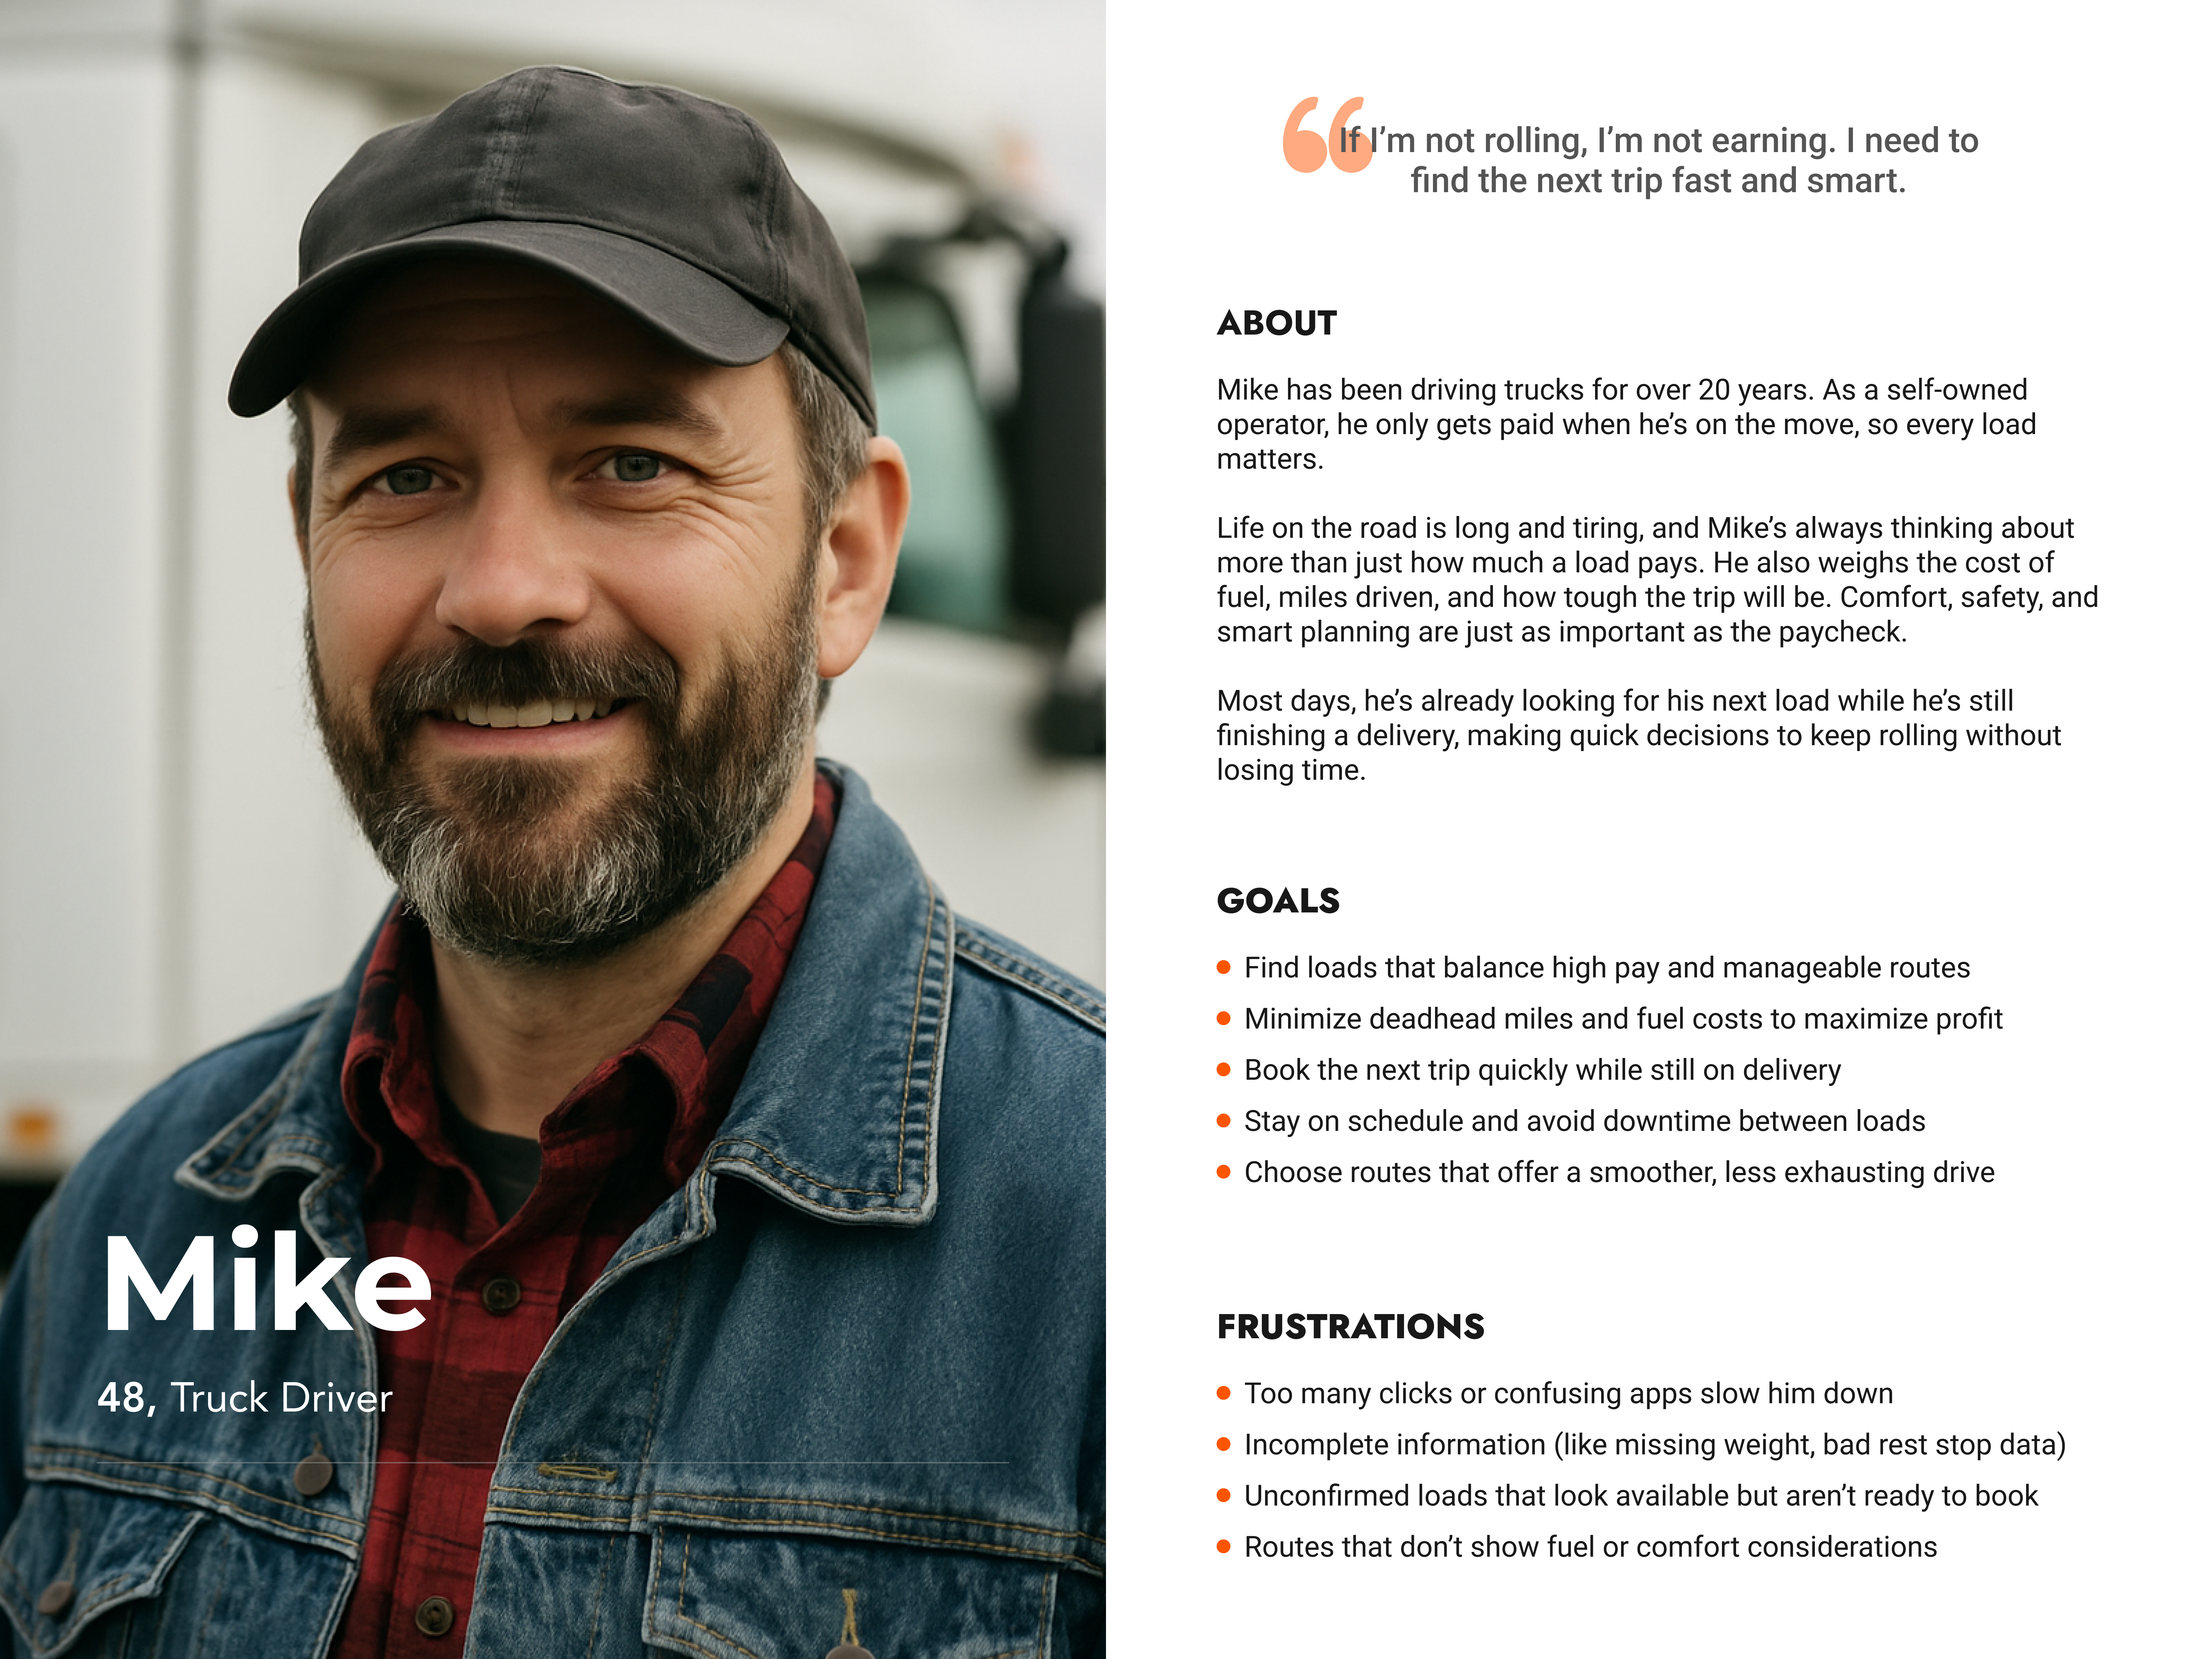
Personas
Our target users fall into two main groups: truck drivers and dispatchers. Drivers care deeply about profitability, but they also factor in driving conditions like weather, road quality, and the availability of rest areas. Dispatchers, on the other hand, prioritize profits as well, but they typically use larger screens and prefer interfaces that are easy to scan and manage from a desktop or tablet.
Ideate
Our research showed that route information plays a key role in how drivers choose loads, with important details like load type, distance, and stop locations often tied to specific routes. Based on these findings, we focused on improving the search and results experience. To help drivers make decisions more easily, we designed a map-based solution that shows this information visually and in context. By keeping the focus on only the most relevant details, the design reduces clutter and supports quicker, more confident choices.
Design Response
First Draft:
The first draft included basic search, map, and results, with routes shown directly on the map to help users quickly compare options.
Second Draft:
The second draft focused on improving clarity and convenience by adding favorites, sorting options, and more detailed filters like weight and estimated time. I also used highlight colors to clearly show the selected route on the map.

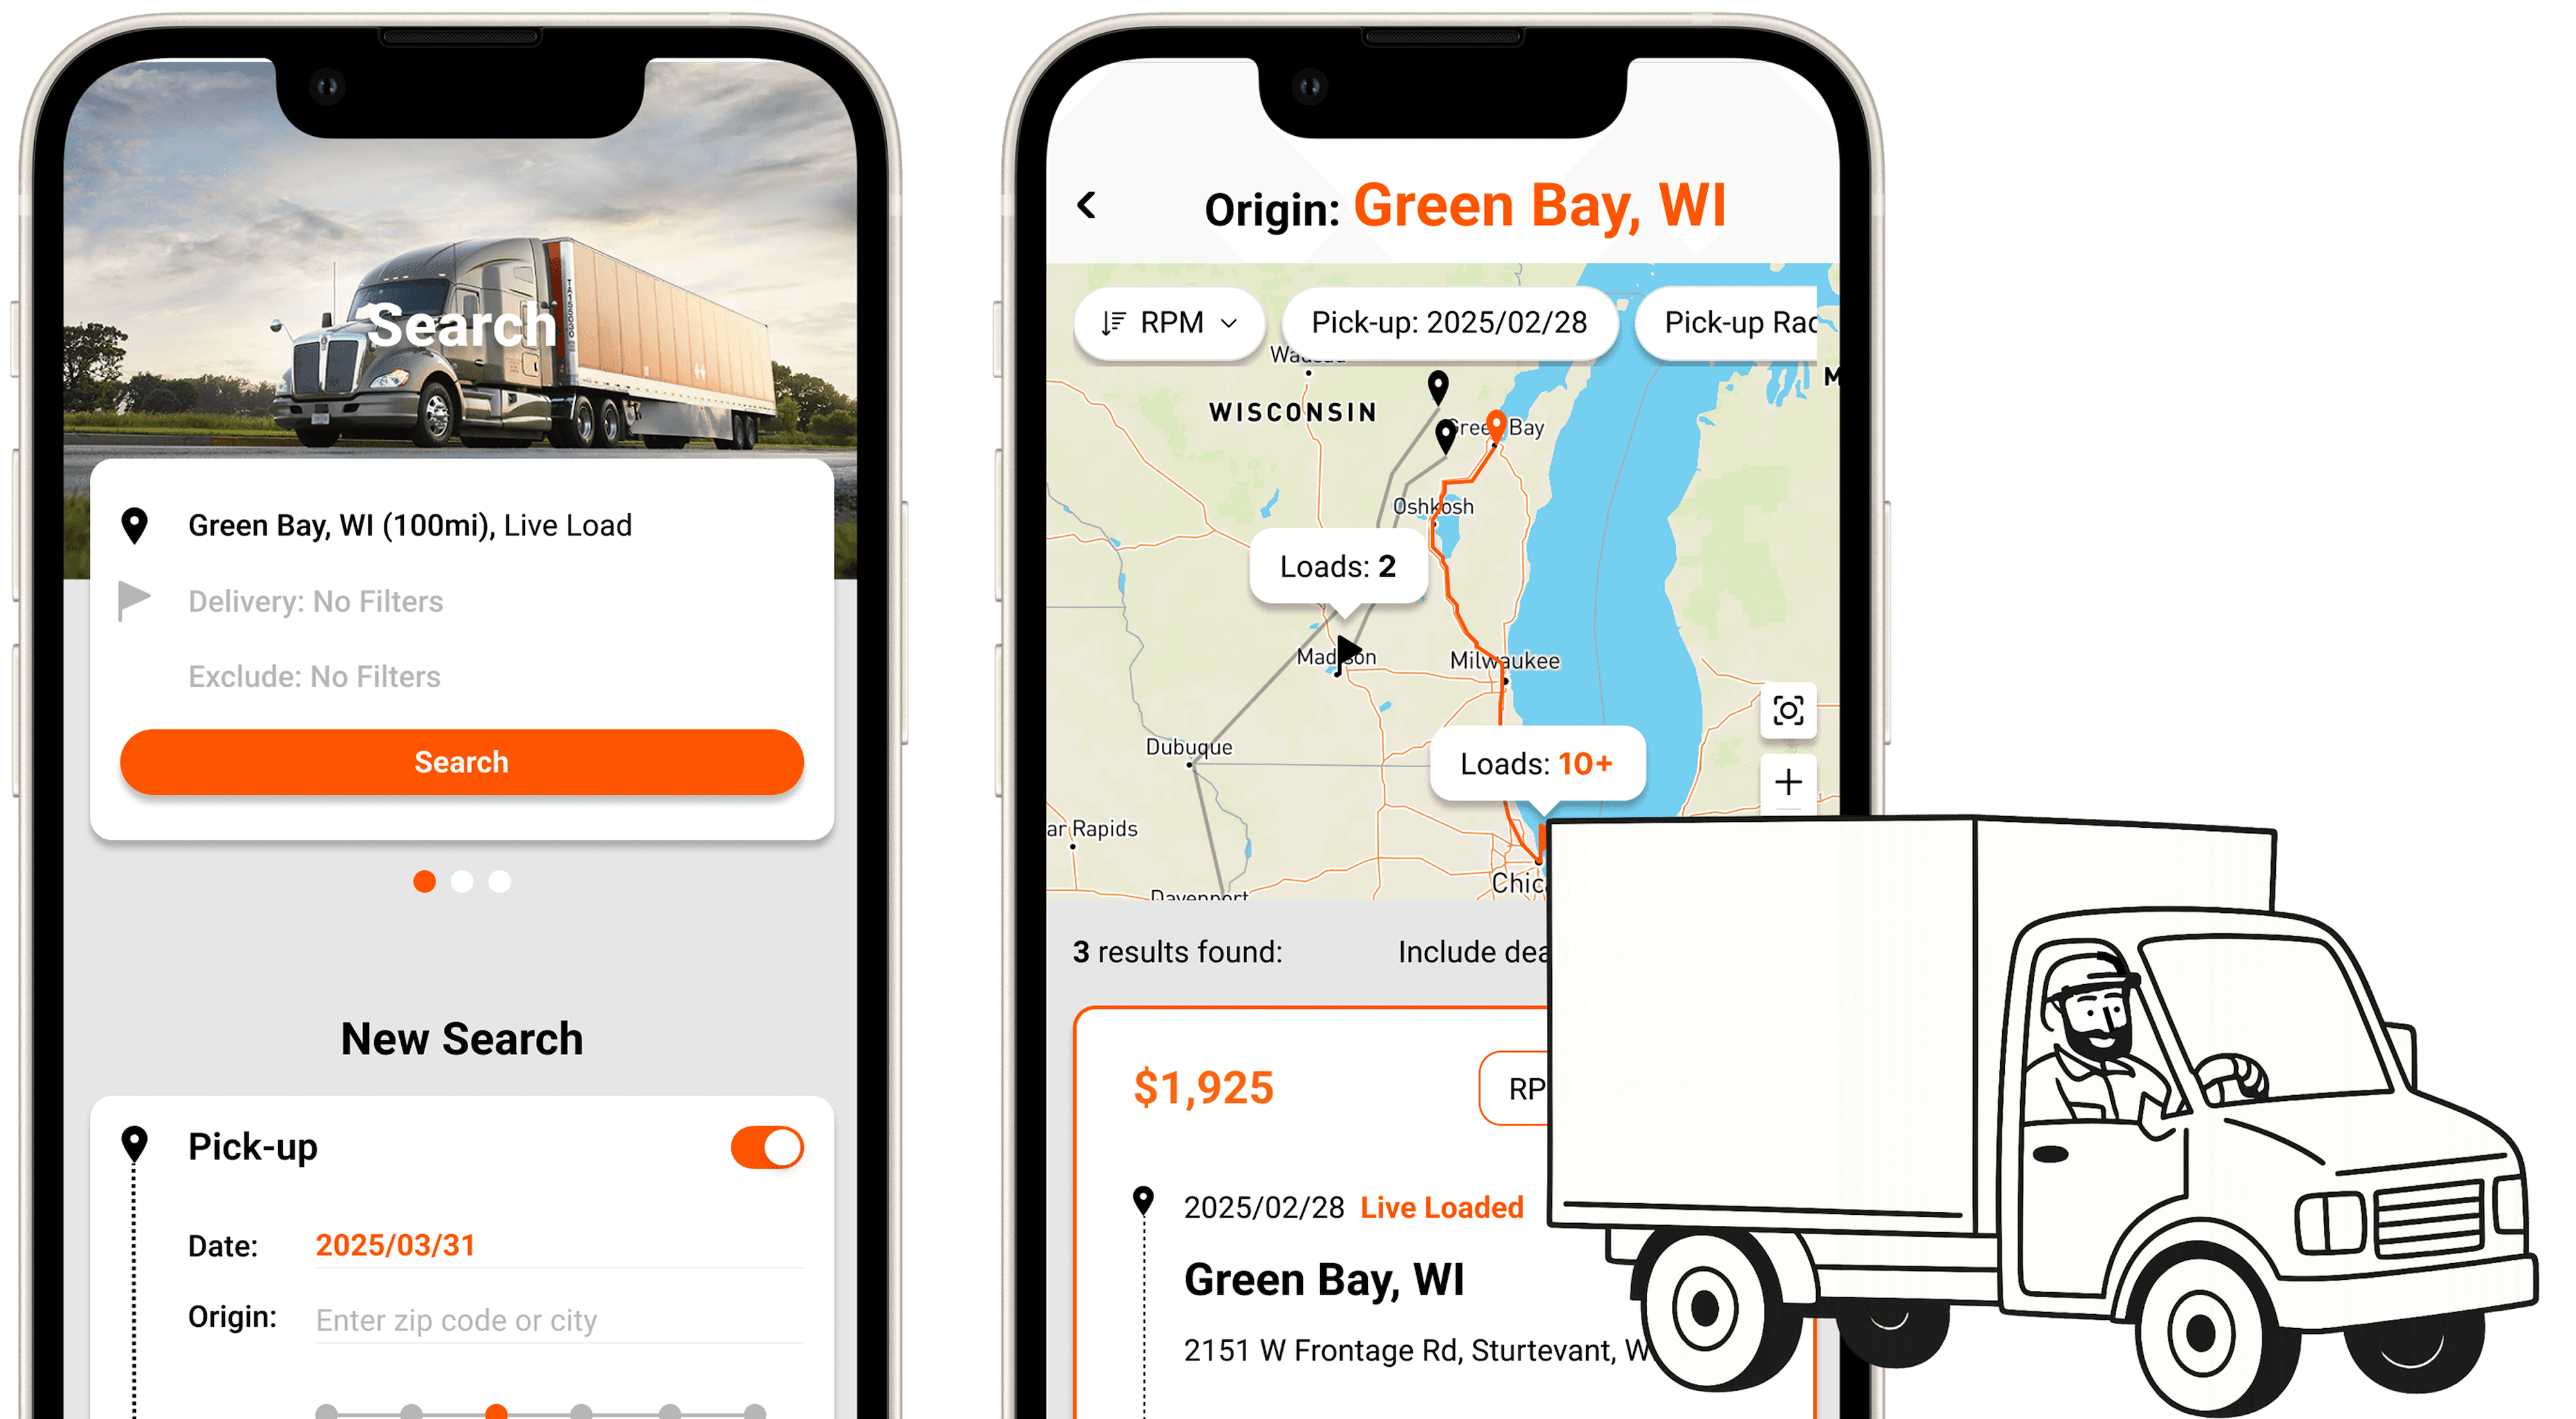
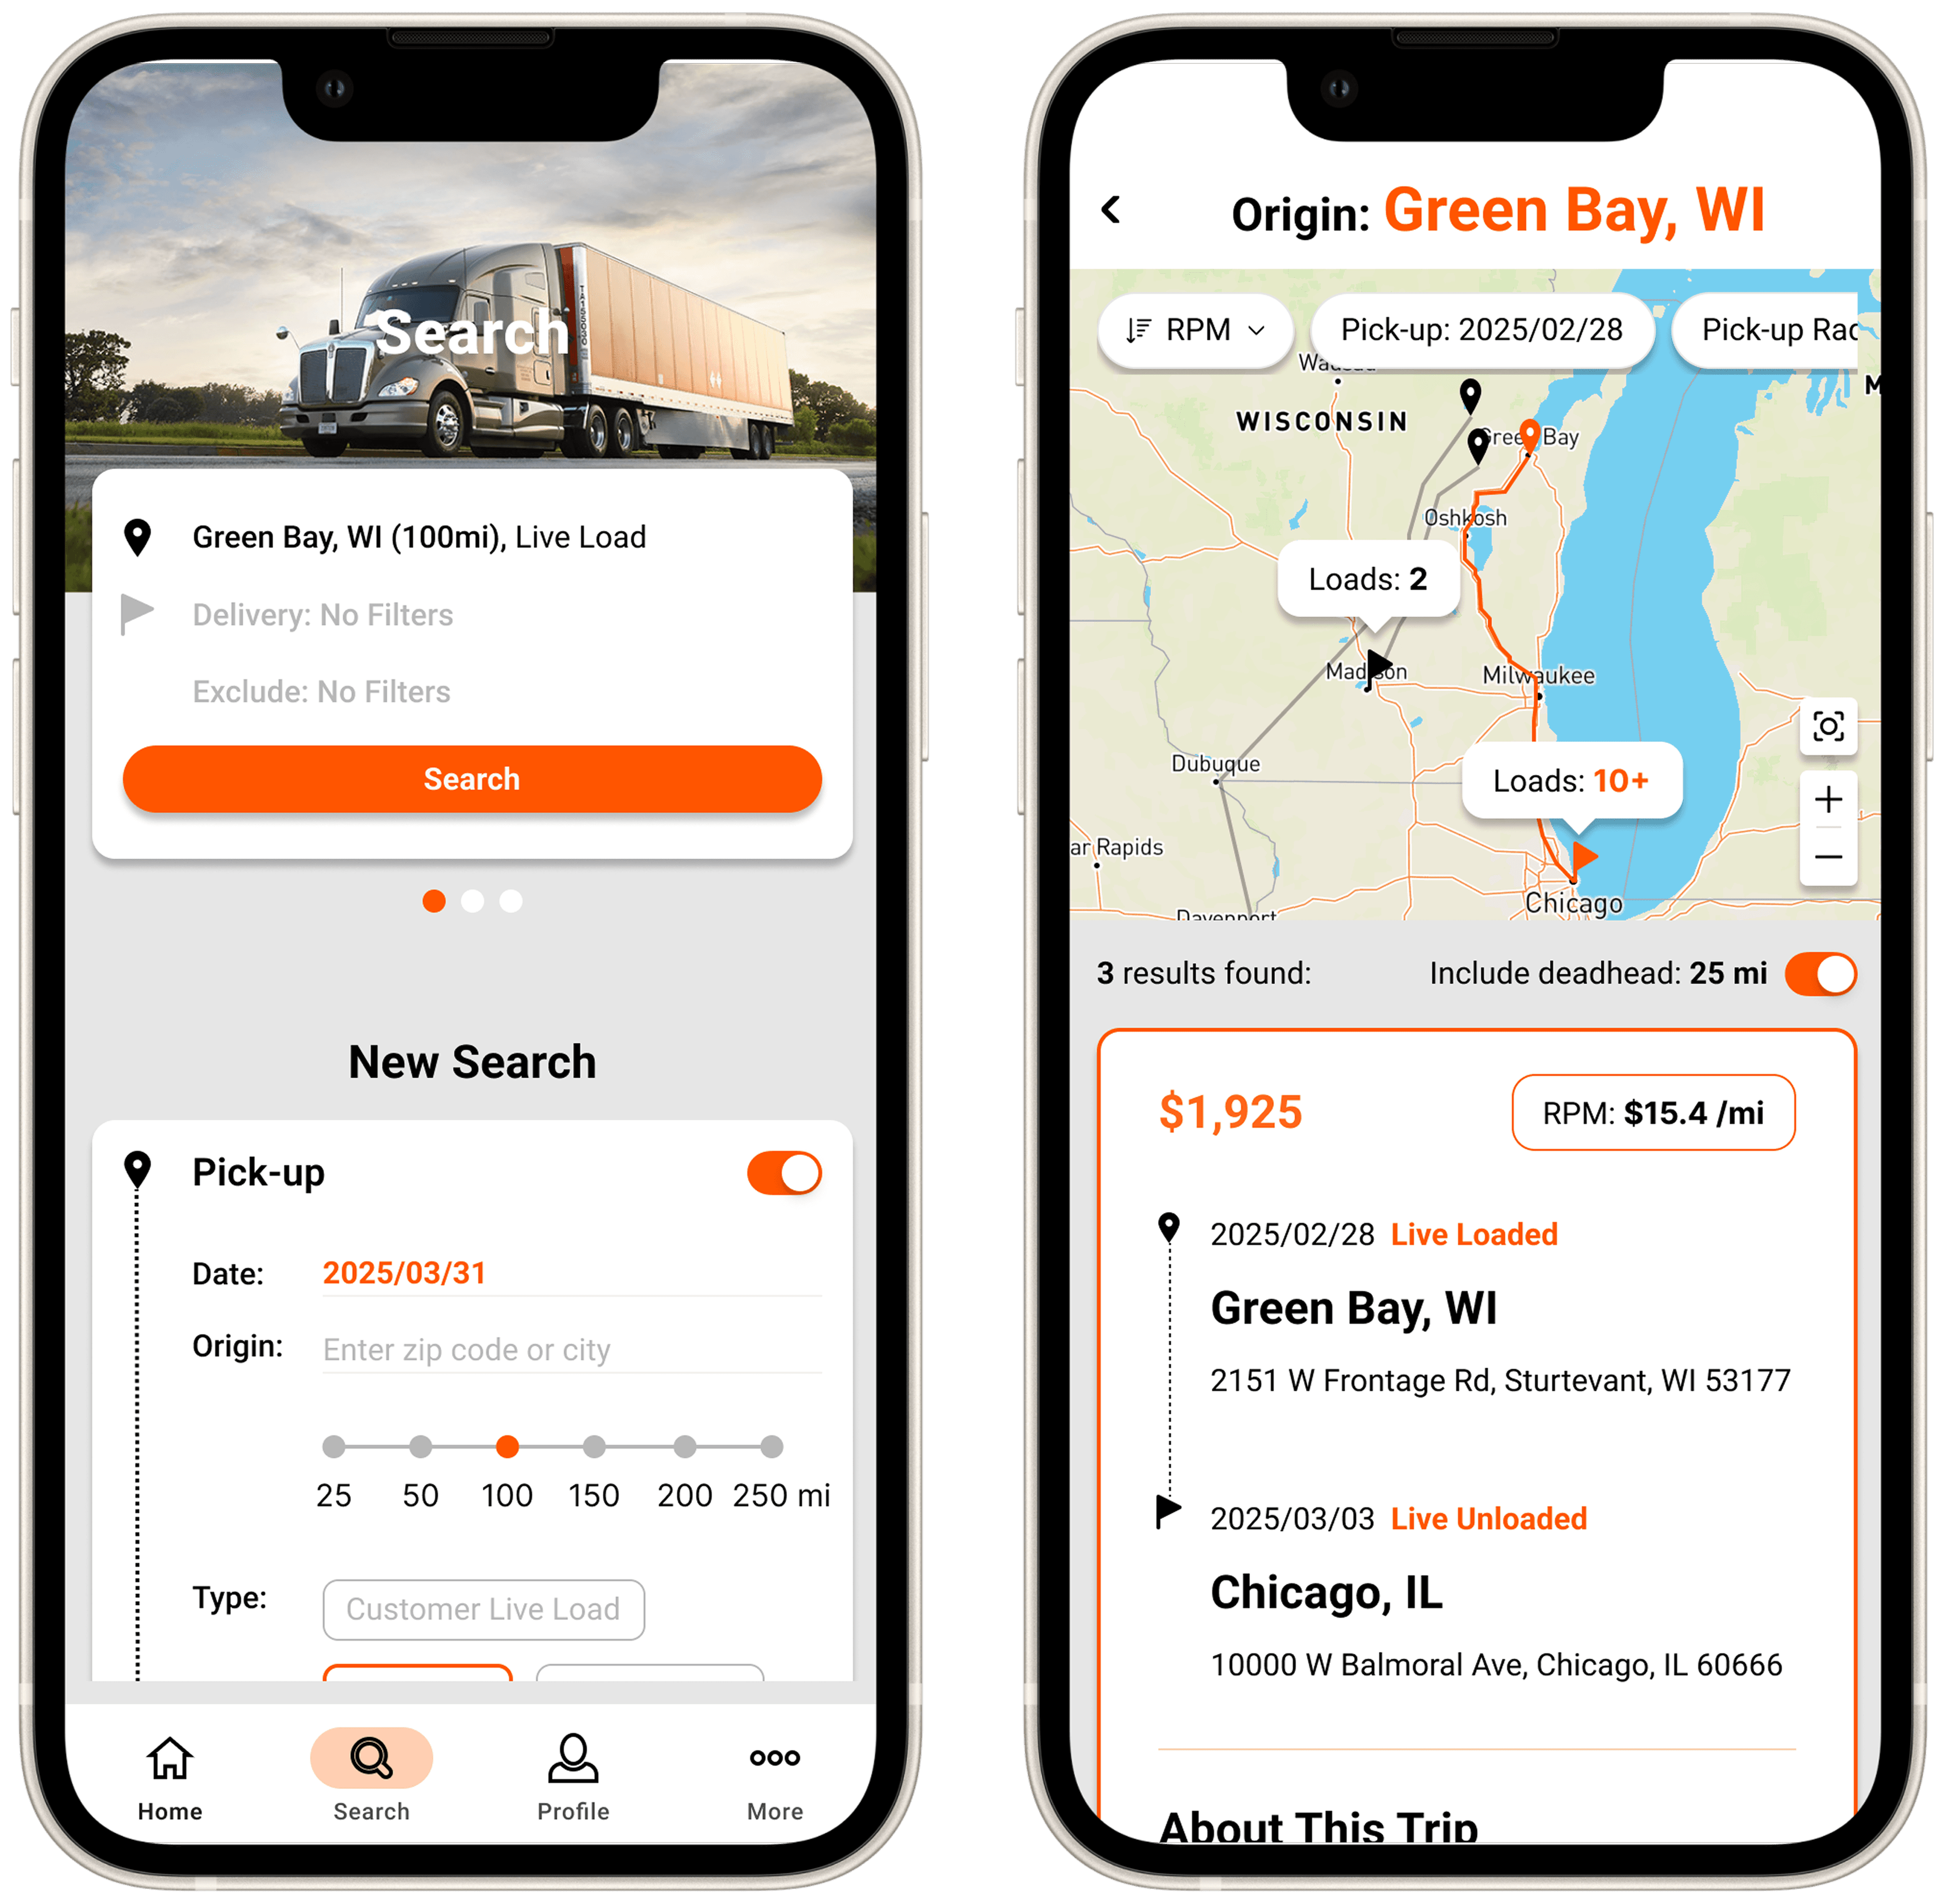
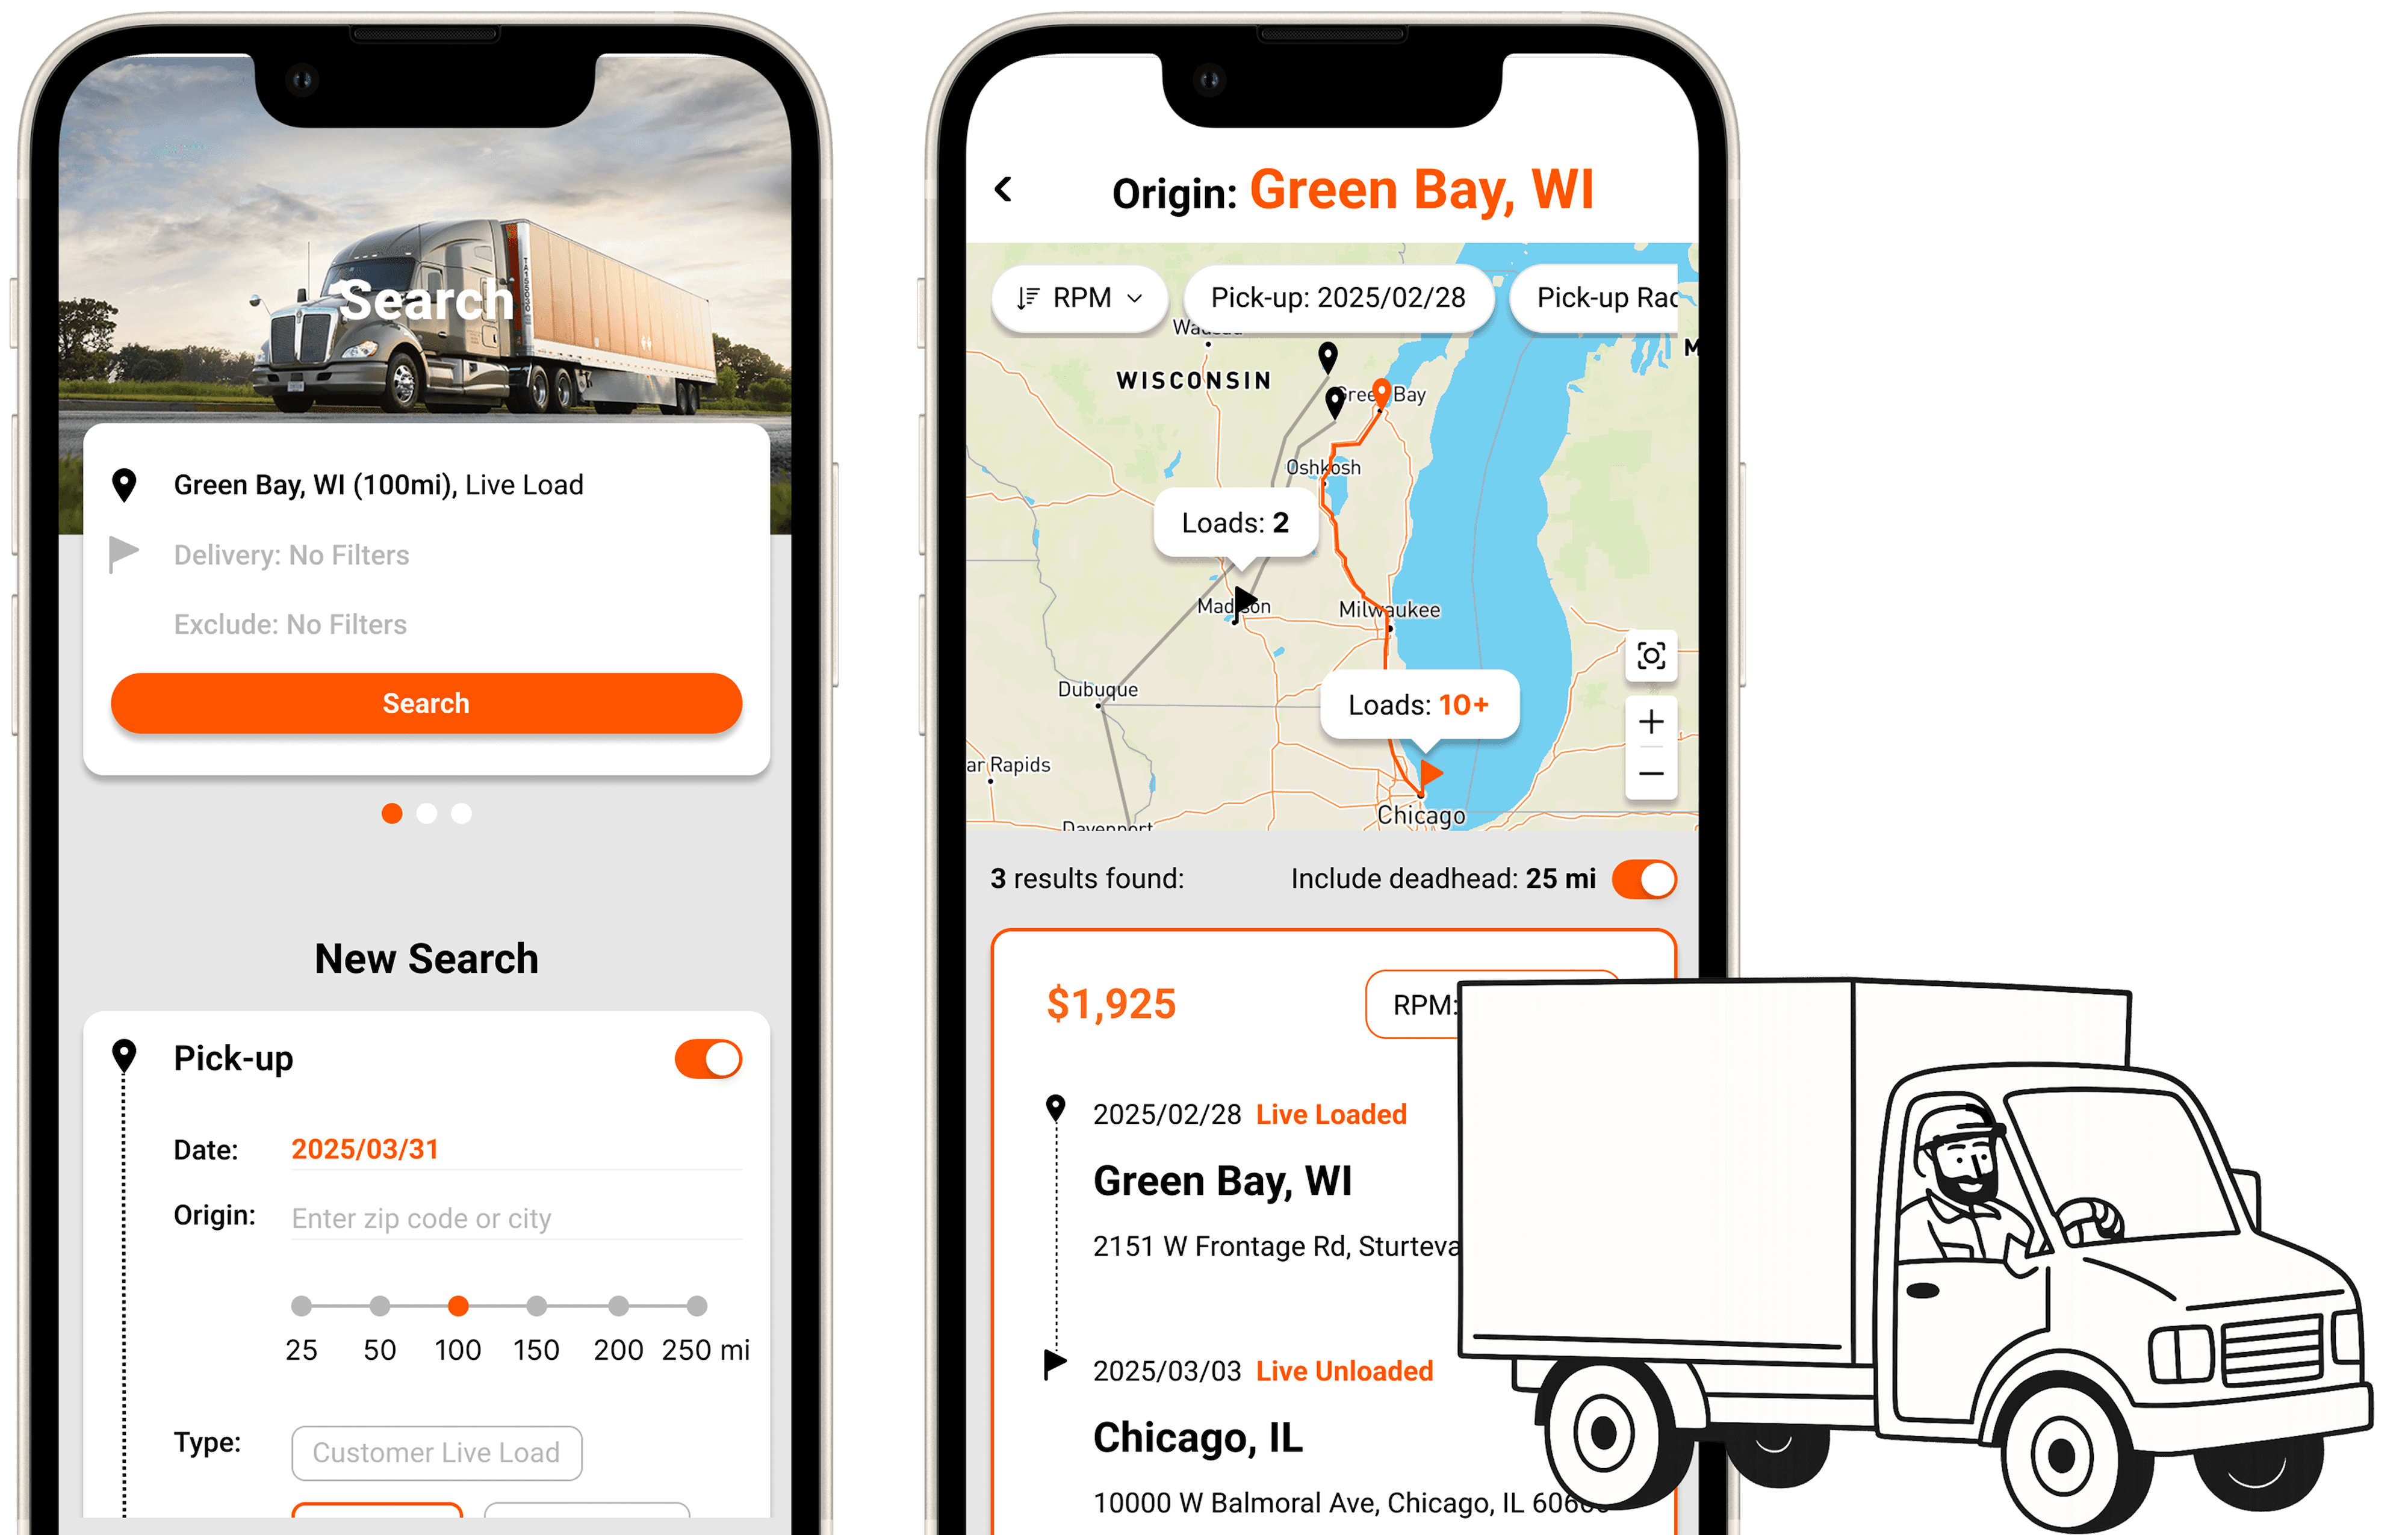
Final Design:
The final design focused on creating a consistent, streamlined experience. I reduced steps by integrating favorite settings into the search page and added an “Exclude” option for advanced filtering. Instead of fuel data, we showed upcoming opportunities to support quicker decisions. We also included deadhead and earnings calculations, introduced multistop trips, and added more route details.
Design Systems:
I followed Schneider’s brand guidelines by using the official highlight color and kept the overall style clean and concise. To ensure consistency and reduce the learning curve, I reused existing components instead of introducing new patterns.

Reflection
Looking back on this design process, I’ve gained several key insights that will significantly shape my future projects.
1. Prioritizing What Matters
The trucking industry comes with a lot of details, and showing everything at once can be overwhelming. So instead of displaying all the information, we focused on highlighting what matters most to help users stay focused and make decisions more easily.
2. Design Is More Than Just Design
One thing that surprised me during an interview with an end-user support agent was learning that some users intentionally avoid certain states. This could be due to harsh weather, strict regulations, or specific product restrictions. Without this insight, my design decisions might have missed key real-world needs.
This project reaffirmed my commitment to clear problem framing and user validation—two practices I’ll continue to rely on in every project going forward.